libbrailleReading by touch

An independent publication about braille and tactile reading. A C library called libbraille was once one of the pieces of software that let Linux drive a braille display. This publication is not that software and has nothing to do with it.

libbraille / Tactile Beyond Braille

Position 5 · Tactile Beyond Braille

What a Raised Line Can and Cannot Show

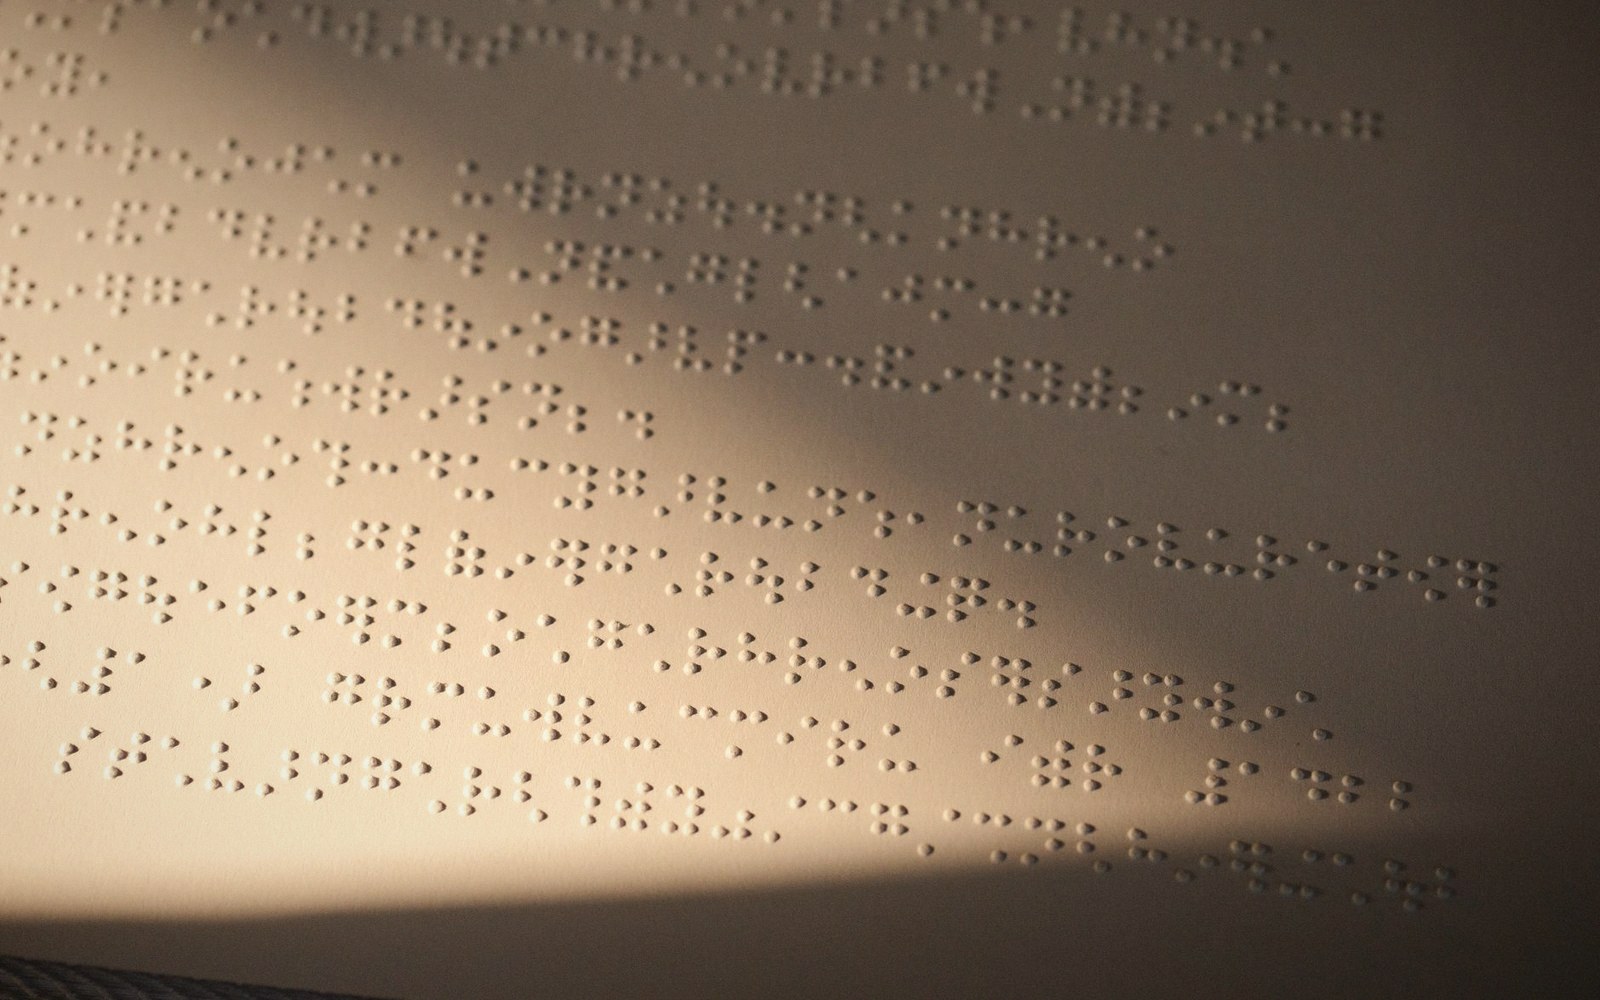
Swell paper raised-line diagram raking light texture
01

The medium's hard limits

A sighted reader navigating a diagram can parse dozens of simultaneous cues in a single glance: line weight, colour, proximity, shading, spatial layout, labels sitting beside what they describe. A tactile reader working the same diagram must do all of that serially, moving a fingertip across a surface that encodes information in exactly one channel — height — against a sensory system whose spatial acuity is far coarser than the eye's. The gap between what a visual diagram assumes and what a raised surface can deliver is not a design problem with an elegant solution. It is a physical constraint with a known shape.

Three production methods dominate the field. Swell paper (sometimes called capsule paper or Piaf paper after a common brand of heat-expansion machine) uses a coating of microcapsules containing alcohol; when a printed sheet passes through a calibrated heat source, black areas expand and lift. Vacuum forming presses a heated thermoplastic sheet over a master mould — typically produced by a laser cutter or 3D printer — to create durable overlays. Collage and direct embossing round out the toolkit for bespoke production. Each method imposes different minimum feature sizes, different degrees of tactile contrast between elements, and different tolerance for fine detail. Swell paper can raise a line as narrow as roughly a millimetre, but closely spaced lines merge into an undifferentiated ridge if they sit within about three millimetres of each other. Vacuum-formed overlays can carry more complex three-dimensional relief but depend on a physical master that takes time and skill to produce. In every case the production floor sets a ceiling on what the designer may attempt.

02

What translates and what does not

Some visual conventions survive the translation to touch remarkably well. A simple closed boundary — the outline of a country, a cell membrane, the edge of a mechanical part — transfers cleanly because the fingertip is good at tracing a continuous edge and inferring the shape it encloses. Directional arrows work if they are large enough and unambiguous in orientation; a blunt chevron readable at eight millimetres fails entirely at four. Texture-fill patterns, used to distinguish regions the way colour-coding does in a print map, work provided the patterns are geometrically distinct enough to feel different rather than merely different in density. Widely spaced dots, closely spaced parallel lines, and a crosshatch are distinguishable; two densities of random stipple are not.

What does not translate is a longer list. Continuous gradients — the shading that shows a hillside getting steeper, or a probability density function tapering off — have no tactile equivalent because height variation fine enough to suggest gradation is also fine enough to be imperceptible. Dashed and dotted lines are a borderline case: they can encode a second line type if the gaps are large enough to feel clearly empty, but they push hard against the fingertip's acuity and often read as a broken solid line rather than a convention. Colour-coded networks — metro maps being the obvious example — lose all categorical information unless the designer substitutes texture or line-style coding with enough contrast to survive the translation. Labels are perhaps the sharpest problem: print diagrams embed text inside a figure or float it adjacent to the element it names, relying on spatial proximity to create the association. A braille label is a wide rectangle of cells, and it rarely fits where a print label sits. Positioning it outside the diagram breaks the proximity link; connecting it with a line leader adds clutter that reads as another element.

The perceptual side compounds the production side. The fingertip resolution limit — the minimum distance at which two points are felt as separate — runs at roughly one to two millimetres at best, which is why braille cell design settled where it did. But diagram reading imposes an additional demand: the reader must integrate information gathered across a sweep of finger travel, holding a mental model of the whole while exploring a part. Visual readers do this effortlessly because the eye can re-fixate any point in milliseconds. Tactile readers accumulate the diagram gradually, which means that complex topologies — overlapping regions, branching networks, elements nested inside elements — create an integration load that has no equivalent in vision. A diagram that looks clean on the page can be cognitively expensive to reconstruct through touch alone.

03

Designing for what touch actually is

The practical upshot for anyone producing tactile diagrams is that simplification is not a concession to the medium — it is the medium's demand. Each visual layer that cannot survive translation should be stripped, not substituted with a workaround that adds clutter. Line types should be limited to two or three at most, chosen for maximum tactile contrast. Regions should be distinguished by texture patterns tested with actual users before finalising a production run. Labels belong outside the figure with a clear, consistent reference system — numbered keys are more robust than leader lines. And the diagram should be readable at the scale it will actually be read: a detail that works at A3 may be unresolvable when printed A4.

None of this makes raised-line diagrams a lesser medium. It makes them a different one, with its own grammar — one that rewards designers who understand what the fingertip is actually doing.